Audit the advertised walk
Japanese property advertising commonly converts road distance using 80 metres per minute under the industry convention, but real trips include signals, slopes, crossings, station entrances and vertical circulation. Trace the stated route on foot at relevant times. Record the entrance used and whether that entrance is open for the full service day.
A building can be close to a station boundary and still be far from the platform. For large or deep stations, entrance-to-platform time can exceed the street walk.
Compare door-to-destination time
Choose actual destinations: office, school, airport connection, hospital or major commercial centre. Measure door-to-platform, expected waiting, in-vehicle, transfer walking and final access. A direct local service may beat a faster line that requires two uncertain transfers.
Run peak and off-peak. Express patterns, through services and last trains can change usefulness. Do not treat every station on the same line as offering the same service.
Price transfer friction
A transfer adds walking, waiting, crowding and missed-connection variance. The penalty is larger for small children, luggage, mobility constraints and late-night travel. Test the physical transfer rather than counting line colors on a map.
Through service can remove a transfer but also transmit disruption from another railway. Identify alternative routes and the cost of using them. Resilience may support tenant demand even when the primary commute is slightly longer.
Read station use carefully
MLIT's National Land Numerical Information and official transport statistics can provide station and network context. Passenger counts describe flow, not automatically residential desirability or future price. Interchange traffic, tourism and employment can dominate.
Use counts with population, housing stock, completed transactions and on-foot observation. A busy station can bring retail and access while also producing noise, congestion and development pressure.
Inspect the walking environment
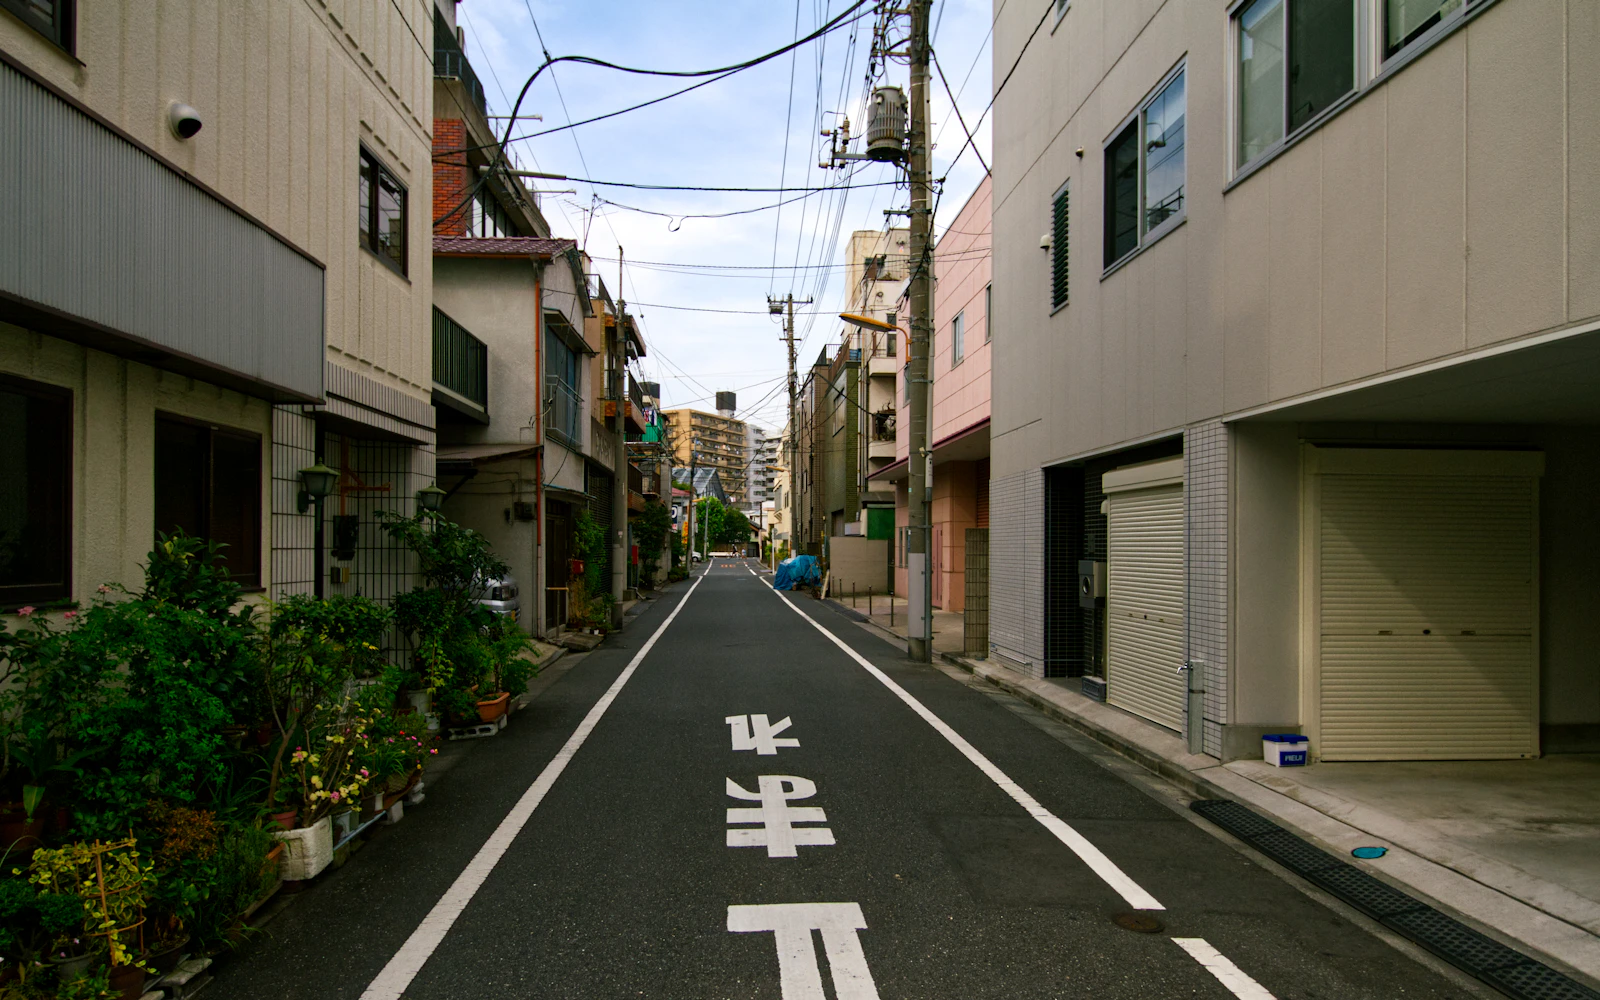
Walk in rain and after dark where practical. Note grade, shade, flood routes, highway crossings, narrow pavements, bicycle conflict, lighting and whether the route feels usable for the likely occupant. Check hazard maps along the route, not only at the parcel.
Two buildings with the same advertised minutes can have different daily utility because one route is level and legible while the other crosses a rail line or major road.
Test future claims separately
For a new station, extension or grade separation, record the responsible public authority, adopted plan, funding, approvals, construction status and expected opening. Separate announced, funded and operating states. Do not pay today for every forecast benefit.
Also model disruption during construction and the chance that new supply captures part of the benefit. A transport project can improve access without guaranteeing the subject outperforms.
Translate access into the product brief
For a rental, identify the tenant segment for whom the route is competitive and test rent against signed evidence from that segment. For owner use, time the trips the household will actually make, including school drop-off, groceries and weekend travel. For resale, identify whether the next buyer will recognise the route or require a price advantage.
Record a transport downside: service reduction, missed last connection, construction disruption, loss of through service or inability to use stairs. The model need not predict these events; it should show whether the property's attraction survives them. A unit bought only because one perfect timetable connection works is more fragile than the headline minutes suggest.
Put transport into the comparable set
Match completed transactions by station, service level, realistic walking route and barrier effects. Test whether observed price or leasing differences remain after controlling for age, size, quality and condition. Avoid one universal price-per-minute adjustment.
The conclusion should name who benefits, their actual trip, the evidence date and what transport weakness remains. That is more useful than “excellent access.”
Primary sources
- MLIT — National Land Numerical Information download service: https://nlftp.mlit.go.jp/ksj/
- MLIT — Urban and regional transport statistics: https://www.mlit.go.jp/sogoseisaku/transport/sosei_transport_tk_000007.html
- MLIT — Real-estate information library: https://www.reinfolib.mlit.go.jp/
Reviewed 23 August 2026. Verify current timetables and station access operationally; official spatial and transaction data provide the durable evidence base.
Looking for a shorter starting point? Browse direct answers to common Japan property questions.
Apply this to a real property
Send us the asset or the brief.
We can review whether the property, structure, financing path, and exit logic hold together.